Non-dom Status In The UK

Non Dom Status In UK


Non-dom Status In The UK
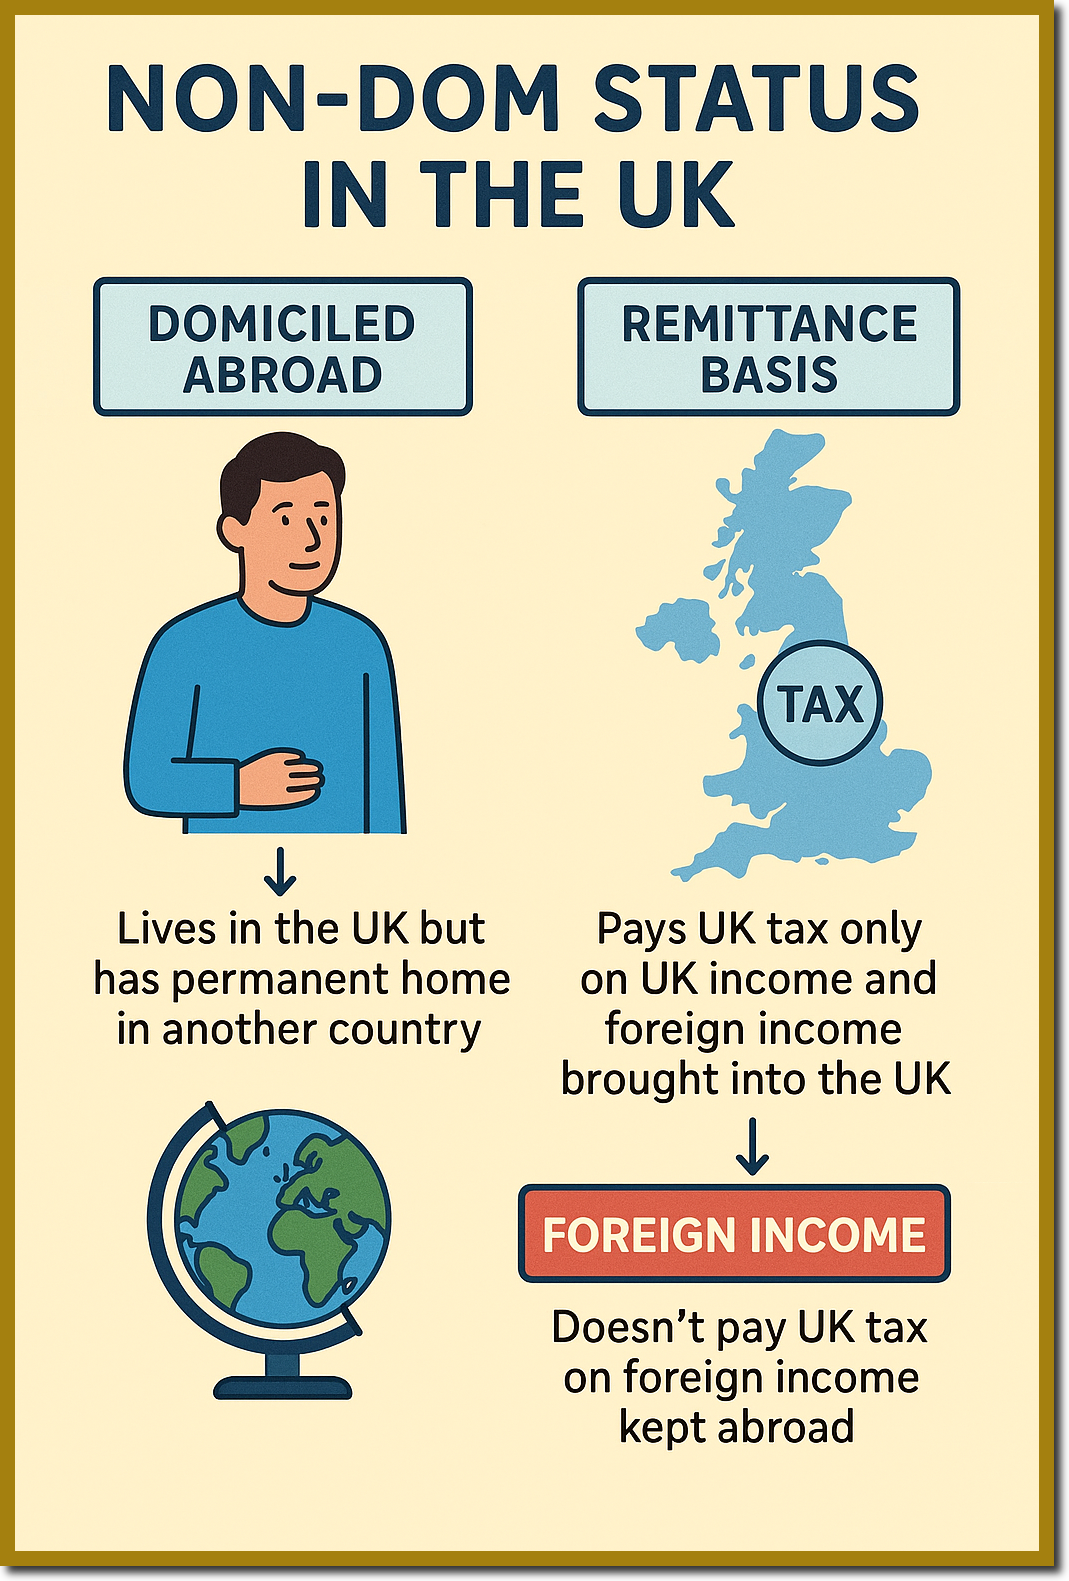
“Non-dom” describes a UK resident whose permanent home – or domicile – for tax purposes is outside the UK. It refers to a person’s tax status. While the UK government estimates that abolishing the non-dom tax status, will raise over £12 billion to £34 billion over the next five years. However,  analysts warn that the changes could actually cost the Treasury, with some estimates suggesting a potential £10 billion annual loss in revenue due to the exodus of wealthy individuals.  Most non-doms are based in London, particularly in areas like Kensington and Westminster. The UK government abolished this system to replace it with a new, residence-based regime.

  • New System:  From April 6, 2025, a new four-year foreign income and gains (FIG) regime was introduced. New arrivals to the UK do not pay tax on foreign income for their first four years of residence, but after that, they are taxed on their worldwide income.
  • Transition:  Specific rules, including a Temporary Repatriation Facility (TRF) and capital gains tax rebasing, were introduced to help transition existing non-doms to the new system.
  • Disclaimer:  This information reflects the status of the non-dom regime up to its abolition in April 2025 and subsequent changes.

Ref Policy Paper:  Reforming The Taxation Of Non-UK Domiciled Individual 


New Residence Based System

The UK government is abolishing the traditional non-dom status, to replace it with a new residence-based system starting in April 2025. The net impact remains highly uncertain, depending on whether the tax increase on those who stay, outweighs the loss of investment from those who leave. While the government aims to raise significant revenue, some studies suggest that if 25% of non-doms leave, the net gain could be zero, and a 50% exodus could lead to a £2.4 billion loss in the first year alone.


Potential Gains vs. Losses

  • Economic Impact: The changes have already been linked to a £400 million loss in stamp duty revenue.
  • Wealth Migration: Reports indicate a significant “flight” of high-net-worth individuals, with one report predicting a net loss of approximately 16,500 millionaires from the UK in 2025.
  • Impact on Revenue: Non-doms contributed just under £9bn in tax in 2023. The loss of this tax base could necessitate a 1.5p increase in the basic rate of income tax to compensate.
  • Alternative View: Some, such as researchers from the London School of Economics, have argued that scrapping the tax status could actually raise £3.6 billion a year, suggesting that the feared mass exodus may be exaggerated.

The final impact of the changes introduced to make the tax system fairer by ensuring long-term residents pay tax on foreign income, is dependent on the behavioural response of non-doms. Approximately 83,000 to 83,900 people in the UK held non-domiciled (non-dom) tax status in the year ending 2024, representing a slight decline from previous years. Figures from HMRC show that while the number of individuals claiming this status was roughly 68,800 to 74,000 between 2021 and 2023, total taxpayers including “deemed” domiciles reached about 83,800 in 2022/23.

  • Recent Data (2023-2024): An estimated 83,000 non-domiciled and deemed domiciled taxpayers existed, with 9,100 new arrivals and 9,500 people leaving the status.
  • Previous Data (2021-2022): HMRC reported 68,800 individuals claimed non-dom status in the 2021-22 tax year.
  • Trend: The number of non-doms peaked in the early 2010s (over 113,000 in 2012/13) and has generally decreased due to rule changes.
  • Concentration: Most non-doms are based in London, particularly in areas like Kensington and Westminster.
    The UK government is abolishing the traditional non-dom status to replace it with a new residence-based system starting in April 2025.

Key Features of the Former Non-Dom Status:

  • Definition of Domicile: Domicile is generally where a person’s father had his permanent home at the time of their birth, or a place they have adopted as their permanent home, which is not necessarily their country of birth or citizenship.
  • Remittance Basis of Taxation: Non-doms could choose to be taxed on the “remittance basis.” This meant they only paid UK tax on foreign income or gains if they brought (remitted) that money into the UK.
  • Costs and Duration: While non-dom status could be used indefinitely in theory, it became costly over time. After being in the UK for 7 of the last 9 years, a £30,000 annual charge was required; this rose to £60,000 after 12 of the last 14 years.
  • “Deemed Domicile”: After living in the UK for 15 out of 20 years, individuals were automatically treated as “deemed domiciled” for tax purposes and taxed on their worldwide income, similar to standard UK residents.

Disclaimer Read More

The information provided on this site is for general informational purposes only and does not constitute professional advice. Use of any information is solely at your own risk. We also accept no responsibility or liability for the personal opinions published in views, blog posts, opinion pieces or articles that comprise opinion pieces.

UK National Debt! £500 Million Per day

Video : Reeves Has A Serious Problem  
Youtube Channel: Eureka UK | Subscribers: 6.24k


UK National Debt
Rising By More Than £500 Million Per Day!

The UK national debt is the total quantity of money borrowed by the UK Government at any time, through the issue of securities by the British Treasury and other government agencies. For the first time ever, the UK’s national debt is rising by more than £500 million per day — over £5,900 every second.

While headlines point to a drop in December borrowing, the wider picture tells a different story.  Debt at the end of April 2025 was equivalent to 95.5 % of the annual value of everything produced in the UK economy, 0.7 percentage points higher than a year earlier.

The UK national debt currently stands at £1.6 trillion and is growing at a rate of £5,170 per second! The UK national debt is the total quantity of money borrowed by the UK Government at any time, through the issue of securities by the British Treasury and other government agencies.View  realtime calculator

Even as the living standards of average households fall, the nation’s debt continues to rise at an astronomical rate. Our debt clock shows that more than £500 million is added to the debt every single day, or £24 billion since Christmas.


Who Owns UK Debt?

Most UK government debt (gilts) is owned by domestic and international private financial institutions (pension funds, banks, insurers) and, significantly, the Bank of England  (with Quantitive Easing), overseas investors holding a large portion, though data can shift, reflecting ownership by UK pension funds, banks, and foreign entities like Japanese banks or US funds. Roughly a third is owed to ourselves (BoE/government), another third to foreign investors, and the rest to UK private sector investors.


Quantitative Easing (QE): This is a monetary policy where central banks create new money to purchase government bonds and other financial assets from commercial banks. This increases the money supply, lowers long-term interest rates, and encourages lending and investment when traditional interest rate cuts are ineffective.


Key Owners Of UK Debt (Gilts):


UK Private Sector
:
Pension funds, insurance companies, banks, investment trusts, and individuals own a significant chunk, often around 30-40%.


Bank of England (BoE):
Holds a large amount acquired through QE programs, making up a substantial portion (around 25-30%).


Overseas Investors:
Foreign entities, including banks and investment funds from countries like Japan or the US, own about 28-30%.


UK Government (Internal Holdings):
A portion is technically owed to government bodies, including the Debt Management Office (DMO) and the National Savings and Investments (NS&I).


How It Works

The UK borrows by selling gilts (government bonds). These are bought by large investors, who lend money to the government in exchange for regular interest payments and their principal back at maturity.


Recent Trends

While pension funds were once dominant, the Bank of England’s significant purchases during QE increased its share, alongside growing foreign holdings, making the debt ownership complex and shared between domestic private investors, the central bank, and international markets.


Disclaimer Read More

The information provided on this site is for general informational purposes only and does not constitute professional advice. Use of any information is solely at your own risk. We also accept no responsibility or liability for the personal opinions published in views, blog posts, opinion pieces or articles that comprise opinion pieces.


ID Cards Used In British Schools

ID Card Printer Shop Staff


ID Cards In British Schools?

ID Cards in British schools are increasingly used to bolster security, manage access to facilities (libraries, buildings), and facilitate services like cashless catering, often featuring student photos and names. While not currently a national legal requirement for school attendance, these cards serve as valid, institution-issued identification for accessing student discounts and services.  Smart Cards with embedded microchips can store and process data. There is no official or standardised national ID card system for students in British schools. Usage varies significantly depending on the age group and the individual school’s policies:

1. Primary and Secondary Schools (Ages 5–16)

Students: Most students in compulsory education do not use ID cards. Identification is typically managed through registers and staff familiarity.

Exceptions:
Some schools issue cards for specific functions, such as cashless catering (paying for school meals) or library management.

Digital ID Future: As of late 2025, the UK government is consulting on digital ID for children as young as 13, though this is intended for employment and service access rather than mandatory daily school use.


2. Sixth Form and Colleges (Ages 16–18)

Safeguarding: Because these students often do not wear a standard school uniform, many institutions require them to wear ID cards on lanyards for security and safeguarding purposes.

Standardisation:
These cards are not national; they are designed and issued by the specific college or school and may include the student’s name, photo, and tutor group.


3. Staff and Visitors

Mandatory Use:
Nearly all British schools require staff (teachers, admin, etc.) and visitors to wear visible photo ID badges at all times to comply with Ofsted safeguarding regulations.


4. Voluntary Student ID

Discounts:
Students often apply for voluntary ID cards like the CitizenCard or Young Scot card. These are used primarily for retail discounts or proof of age outside of school rather than for school-based activities.


Identity Banner


How Many ID Cards Are Used In British Schools?

There is no official total for the number of physical ID cards used in British schools, as there is no standardised national requirement for students to carry one. Instead, usage varies by school type and security needs:

Secondary Schools:

Biometric systems (like fingerprints) are now the “norm,” with over 2,500 secondary schools (more than half in the UK) using them for tasks like library checkout and lunch payments. ID cards are typically offered as an alternative for the roughly 2% of students who opt out of biometrics.


Identity Banner


Sixth Forms & Colleges:

Students in Year 12 and 13 often use ID cards more frequently than younger pupils, as they often do not wear uniforms and require the cards for safeguarding identification and campus access.

Staff & Visitors: It is standard practice for staff and contractors to wear photo ID badges for safeguarding and access control.


Private Schools:

Approximately 650,000 children attend over 2,500 independent schools, many of which use smart cards for integrated campus services like library access and on-campus purchases.


The UK Government Is Currently Moving Toward Digital Identification Rather Than Physical Cards:

  • Digital ID Scheme: A new digital ID system is being introduced to provide authoritative proof of identity on mobile devices.
  • NHS Number: The government intends for the NHS number to be the single unique identifier mandated in the upcoming Children’s Wellbeing and Schools Bill.
  • Voluntary Cards: For proof of age outside of school, students often use voluntary PASS cards like CitizenCard, which are widely accepted for retail and venue entry.

Secondary Schools:

Biometric systems (like fingerprints) are now the “norm,” with over 2,500 secondary schools (more than half in the UK) using them for tasks like library checkout and lunch payments. ID cards are typically offered as an alternative for the roughly 2% of students who opt out of biometrics.


Sixth Forms & Colleges:

Students in Year 12 and 13 often use ID cards more frequently than younger pupils, as they often do not wear uniforms and require the cards for safeguarding identification and campus access.


Staff & Visitors:

It is standard practice for staff and contractors to wear photo  ID badges for safeguarding and access control.


Private Schools:

Approximately 650,000 children attend over 2,500 independent schools, many of which use smart cards for integrated campus services like library access and on-campus purchases.


Upcoming Changes

The UK government is currently moving toward digital identification rather than physical cards:

Digital ID Scheme: A new digital ID system is being introduced to provide authoritative proof of identity on mobile devices.

NHS Number:
The government intends for the NHS number to be the single unique identifier mandated in the upcoming Children’s Wellbeing and Schools Bill.


Voluntary Cards:
 
For proof of age outside of school, students often use voluntary PASS cards like CitizenCard, which are widely accepted for retail and venue entry.


Documents

School and college security  | HTML
Self-assessment emergency incident planning checklist | (MS Word Document, 70.3 KB)
Risk assessment template | (MS Word Document, 67.1 KB)
Business Continuity Plan Template And Checklist | (MS Word Document, 89.6 KB)
Evacuation template  | MS Word Document68.6 KB

Bomb Alert And Threat Template | MS Word Document77 KB
Shelter (invacuation) Template|  MS Word Document, 70.3 KB
Lockdown Template  |  MS Word Document, 74.4 KB


Disclaimer Read More

The information provided on this site is for general informational purposes only and does not constitute professional advice. Use of any information is solely at your own risk. We also accept no responsibility or liability for the personal opinions published in views, blog posts, opinion pieces or articles that comprise opinion pieces.

Security In UK Schools

Eastern Community Centre


Security In UK Schools

Security in UK schools is mandated under the Health and Safety at Work Act 1974, requiring employers to ensure the safety of staff and pupils through risk assessments and robust, tailored security policies. Schools implement physical measures like controlled access, fencing, and CCTV, along with procedures for lockdown, visitor management, and emergency response, often in consultation with local police. 

Security in UK schools involves a combination of physical measures, digital safeguards, and policy-driven protocols to protect students and staff. Key measures include CCTV surveillance, access control systems (fobs/badges), secure fencing, visitor management, and increasingly, cybersecurity measures, monitored alarms, and in some cases, knife arches for safety. 

Crime has cost UK schools an average of over £26,000 per institution in the past year, doubling from the previous year due to rising incidents. Key expenditures involve physical security (CCTV, alarms, fencing) and increasing cybersecurity, with  ransomware attacks costing up to £3 million per incident.Over 88% of schools are investing in proactive measures.


Key School Statistics (UK-wide):
Total Schools: ~32,149

Primary Schools: ~20,739
Secondary Schools: ~4,181
Independent Schools: ~2,461
Special Schools/PRUs: ~1,860


Breakdown by Nation:

England: ~24,453 schools (including ~16,764 primary and ~3,452 secondary).
Scotland: ~8,038 schools (includes early learning centres).
Wales: ~1,542 schools.
Northern Ireland: ~1,116 schools.

The number of schools has seen a slight decrease in recent years.There are approximately 32,149 schools in the UK, based on recent 2023/24 data. This total includes roughly 20,739 primary schools, 4,181 secondary schools, 2,461 independent schools, and various special schools and nurseries, with the vast majority located in England.


Physical Security

Access Control & Visitor Management:

Door entry systems such as keyfobs, intercoms, and visitor sign-in procedures are standard to prevent unauthorised access. CCTV Cameras: Installed at entry/exit points, perimeter fences, and in high-risk areas for surveillance and deterrents.

Perimeter Fencing:  Secure fencing and secured boundaries are essential, often combined with lighting to aid CCTV.

Alarm Systems:  Monitored intruder alarms and panic alarms in classrooms for emergencies.

Security Staff:
Use of security personnel for patrols and keyholding, particularly to reduce risks to staff during open/close times.


Metal Detectors:
Some schools implement knife arches or wand detectors to combat knife crime.


Digital/Cyber Security

Cybersecurity Standards: Schools must follow DfE cyber security standards, including using firewalls, antivirus software, and robust, filtered internet connections to protect data.

PDNS for Schools: 
The National Cyber Security Centre (NCSC) provides Protective DNS (PDNS) services to help prevent phishing and malware attacks.


Policy and Training

Emergency Protocols: Schools develop procedures for lockdowns and security incidents.

Staff Training: 
Staff are trained to manage security threats and, through initiatives like ‘ACT for Youth’, educate students on safety.
These measures are often guided by Department for Education (DfE) site security guidance.


Incidents In UK Schools

Incidents in UK schools range from minor health and safety issues to serious criminal activity, including violence, bullying, and significant behavioral issues. Common occurrences include physical assaults, knife-related incidents, widespread racism, bullying, substance abuse, and vandalism, alongside accidental emergencies like fires or severe illness outbreaks. 


Key Types of Incidents

Violent Crime and Weapons: Police reported approximately 20,000 violent crimes in English/Welsh schools in 2024, including 150 knife attacks causing injuries. Incidents of pupils bringing weapons to school have been recorded, even among very young children.


Persistent Disruptive Behavior

A 2024 survey showed declining confidence among staff in managing serious pupil misbehaviour, which includes physical assaults on teachers.


Bullying and Harassment

Over 60,000 racist incidents were recorded in UK schools in a five-year period. There is also a significant rise in antisemitic and anti-Muslim hate, according to 2023 reports.


Abuse Towards Staff

Roughly 20% of teachers reported experiencing verbal or online abuse from parents or guardians.


Health and Safety Emergencies

Common incidents include slips, trips, and falls. Fire incidents are also a concern, often caused by electrical faults. Additionally, schools deal with outbreaks of infectious diseases like COVID-19 or flu.


Safeguarding and Security

Incidents requiring security intervention include threats of violence, intrusion, or the confiscation of banned items such as drugs, alcohol, and weapons.  Security in UK schools involves a combination of physical measures, digital safeguards, and policy-driven protocols to protect students and staff.  

Key measures include CCTV surveillance, access control systems (fobs/badges), secure fencing, visitor management, and increasingly, cybersecurity measures, monitored alarms, and in some cases, knife arches for safety. 


      • Physical Security: Access Control & Visitor Management: Door entry systems such as keyfobs, intercoms, and visitor sign-in procedures are standard to prevent unauthorised access.
      • CCTV Cameras: Installed at entry/exit points, perimeter fences, and in high-risk areas for surveillance and deterrents.
      • Perimeter Fencing: Secure fencing and secured boundaries are essential, often combined with lighting to aid CCTV.
      • Alarm Systems: Monitored intruder alarms and panic alarms in classrooms for emergencies.
      • Security Staff: Use of security personnel for patrols and keyholding, particularly to reduce risks to staff during open/close times.
      • Metal Detectors: Some schools implement knife arches or wand detectors to combat knife crime.
      • Digital/Cyber Security: Schools must follow DfE cyber security standards, including using firewalls, antivirus software, and robust, filtered internet connections to protect data.
      • PDNS for Schools: The National Cyber Security Centre (NCSC) provides Protective DNS (PDNS) services to help prevent phishing and malware attacks.

Disclaimer Read More

The information provided on this site is for general informational purposes only and does not constitute professional advice. Use of any information is solely at your own risk. We also accept no responsibility or liability for the personal opinions published in views, blog posts, opinion pieces or articles that comprise opinion pieces.


UK Unemployment Rate

2025 Autumn Budget


 Rachel Reeves’ November 2025 Budget

After the Chancellor of the Exchequer Racheal Reeves, budget, London now has the highest unemployment rate in the UK – almost doubling in under two years in the worst slump since lockdown. Rachel Reeves’ November 2025 budget introduced significant tax increases—particularly on employer costs and high earners—aimed at strengthening public finances, with major changes taking effect from 2026.

Key impacts included increased income tax for many through frozen thresholds, increased employer costs, higher wages, and targeted benefits changes.  The UK unemployment rate was 5.1%, and 1.84 million people aged 16+ were unemployed. Unemployment levels increased by around 280,000 over the last year, and the unemployment rate has increased from 4.4%


UK Unemployment Rate

Rachel Reeves delivered the budget on 30 October 2025, the first from a Labour chancellor in a decade and a half. Chancellor Rachel Reeves’ budget aimed to bolster public services and stabilise finances, impacting households and businesses through tax changes and investment.

Key consequences included increased national insurance for employers, frozen income tax thresholds until 2028, and a higher minimum wage, with top earners facing higher tax burdens while low-income households may benefit.


Many Wealthy People Leaving The UK

Sixty of the wealthiest people in the UK collectively contribute  more than £3bn a year in income tax. Approximately 9,500 to 16,500 high-net-worth individuals are projected to leave or have left the UK between 2024 and 2025, driven by tax increases, specifically the abolition of the non-dom status. While this is a significant, record-breaking outflow, it represents less than 1% of the total UK millionaire population.


Mass Movement Of Millionaires

Top destinations for these individuals include the UAE, Italy, and Switzerland This year alone, 142,000 millionaires are expected to relocate across borders — the highest number ever recorded — with projections climbing to 165,000 by 2026. Far from a statistical curiosity, this mass movement of millionaires represents the largest voluntary transfer of private capital in modern history.


Closure Of Private Schools

Over 100 private schools in England and Wales have closed or announced closures since Labour introduced a 20% VAT on fees in January 2025, with estimates from the Independent Schools Council (ISC) suggesting around 105 closures, affecting thousands of students, though government data shows fewer official closures, citing other reasons like poor management, while the ISC links closures to the new tax policy’s financial pressure.


9.6% Year-On-Year Decrease In Vacancies

The market is showing signs of cooling with a 9.6% year-on-year decrease in vacancies, which are now below pre-pandemic levels. The UK unemployment level as of January 2026 is approximately 1.84 million people, representing a 5.1% unemployment rate.  Data indicates that unemployment has increased significantly, marking a four-year high, with around 280,000 more people unemployed compared to the previous year. 

As of early 2026 UK job vacancies are approximately 729,000 based on the Office for National Statistics   data from the September to November 2025 period. New analysis by a think tank suggests that more than 700,000 university graduates are out of work and claiming welfare benefits.

The Centre for Social Justice (CSJ) reports that  400,000 graduates were not in work and claiming Universal Credit, according to the latest statistics. There were 240,000 graduates who said they could not work due to health reasons, the think tank said, with that figure having more than doubled since 2019.


Key Trends in 2026

Vacancy Levels:
The number of vacancies has remained relatively flat, hovering around 729,000, representing a continued decline from the 2022 peak.

Sector Performance:
Despite overall declines, sectors with strong demand include childcare, logistics, and engineering.

Labour Market Tightness:
The unemployment-to-vacancy ratio has increased, indicating a rise in unemployment and more candidates available per job.

Employer Outlook:
The job market is expected to remain subdued due to rising employment costs, including national living wage increases, and economic uncertainty, limiting a major rebound in hiring. While the overall number of vacancies is falling, specific sectors such as engineering and IT continue to experience skill shortages, with some areas still showing high demand. 


Key Labour Market Statistics 2026

  • Unemployment Rate: 5.1% (aged 16+).
  • Unemployment Level: 1.84 million, with some reports citing 1.8 million.
  • Jobless Trends: Unemployment has risen, with forecasts suggesting it could reach an 11-year high in 2026, according to Aberdeen & Grampian Chamber of Commerce.
  • Regional Variation: London has the highest unemployment level of any UK region at 7.2%.
  • Vacancies: Job vacancies have fallen to 734,000, which is below pre-pandemic levels, reports FE News.

The rise in unemployment is linked to economic uncertainty, with employers becoming more reluctant to retain or hire staff. Based on data reported up to January 2026, over 500 pubs in England and Wales have closed, since the Labour government took office in July 2024, with reports indicating that over 1,100 pubs and restaurants closed following the October 2024 Budget.

Regarding schools, at least 50 private schools were reported to have closed or announced plans to close following the announcement of VAT on school fees, with some reports citing over 100 closures as of early 2026.


Breakdown Of Pub Closures

  • Total Closures: More than 500 pubs have closed since Labour took office in July 2024.
  • Post-Budget Impact: Reports indicate that 1,100 pubs and restaurants have closed in the wake of the Autumn Budget.
  • Closing Rate: Pub closures have increased from roughly 6 per week in 2024 to 8 per week in early 2025.
  • Contributing Factors: The closures are attributed to a “perfect storm” of high operating costs, including increased National Insurance for employers, minimum wage increases, and a reduction in business rates relief from 75% to 40%.
  • Industry Warning: UK Hospitality has warned that a further 540 pubs face closure in 2026 without additional government support.

Private School Closures

As of August 2025, more than 50 independent schools had closed or announced plans to shut, with some sources reporting over 100 schools closed by January 2026, citing the VAT policy and rising costs.

  • Causes: The closures are primarily attributed to the 20% VAT on private school fees introduced on January 1, 2025, alongside rises in National Insurance and minimum wage.
  • Impact: The closures have caused significant disruption, with reports indicating they affect thousands of children, particularly at schools with lower fees
  • Note: The government maintains that about 50 private school closures per year is typical, arguing that some of these closures are part of long-term trends.

Britain’s Farming Sector

Britain’s farming sector has been hit by an unprecedented wave of closures, with 6,270 agriculture, forestry and fishing businesses shutting down, since Rachel Reeves unveiled her inheritance tax changes on agricultural assets.

A record number of farms have closed in the 12 months leading up to January 2026, driven by declining investment and, according to claims made in the UK Parliament Hansard, the impact of Labour government decisions. While specific, total farm closure numbers are not detailed in that report, it highlights a trend of disappearing agricultural suppliers and sustained pressure on livelihoods.

  • Farm Closures: The 12 months preceding January 2026 saw a record number of farm closures.
  • Context:  Concerns are centered on the failure to launch a new, sustainable farming incentive scheme, contributing to this trend.
  • Industry Scale:  The UK agricultural industry consists of 209,000 holdings.

Please note that the information from the UK Parliament focuses on the 12-month period leading up to early 2026, which aligns with the period following the Labour party taking power in the UK.


Disclaimer Read More

The information provided on this site is for general informational purposes only and does not constitute professional advice. Use of any information is solely at your own risk. We also accept no responsibility or liability for the personal opinions published in views, blog posts, opinion pieces or articles that comprise opinion pieces.


When UK Universities Were Free

SEO Training Courses


When UK Universities Were Free

There are now over 160 higher education institutions with university status in the UK, with some estimates identifying 164–166, such as those listed by uniRank. When including all higher education providers, such as colleges and specialist institutions, the total is around 260 to 296, according to Prospects and Statista, respectively.

From 1962 until 1998 university education in the UK was effectively free, with tuition fees paid by the state and maintenance grants available, from 1962 until 1998. Following the Education Act 1962, this policy covered full-time, “ordinarily resident” students, with maintenance grants often covering living costs. Today the average student debt £53,000, with some graduates having £250,000 of student debt.

Ref: Uk Universities


Timeline Of  Free University Education In The UK:

1945–1962: Following World War II, local authorities generally covered fees, a practice solidified by the 1962 Act.
1962–1998:  The “free” era, where the government paid tuition and provided maintenance grants to most students.
1998:      The Teaching and Higher Education Act 1998 introduced upfront tuition fees of up to £1,000 per  year.  Post -1998

Changes:  Fees increased to £3,000 in 2004 and up to £9,000 by 2012.  While tuition was free for many, maintenance grants were often means-tested.


Tuition Fees Introduced By Tony Blair

Tony Blair (Labour) introduced tuition fees for UK universities, with the policy taking effect in 1998. Following the Dearing Report, the government implemented means-tested fees of up to £1,000 per year, which were initially paid upfront by students. This marked the end of free higher education in the UK.

Outstanding student loan debt in the UK reached over £292 billion by the end of the 2024–25 financial year, with the vast majority (£266.6 billion) held by borrowers in England. The total debt is projected to rise to around £500 billion by the late-2040s. 


Key Details Regarding The Introduction Of Tuition Fees:

  • Context: The policy was introduced to help fund growing student numbers.
  • Structure: Under the initial 1998 system, students from higher-income families paid up to £1,000, while those from lower-income families had fees waived.
  • Opposition: The move was controversial and faced significant, though ultimately unsuccessful, opposition within the Labour party.
  • Subsequent Changes: While Blair introduced the fees, further reforms and significant increases occurred under later governments, including the introduction of “top-up” fees in 2004/2006

Average Student Debt £53,000

According to figures from the Student Loans Company (SLC) and,  analysis by the UK Parliament, borrowers who completed their courses and entered repayment in 2024 (specifically those becoming liable to repay in April 2025) had an average debt of approximately £53,000. 

For the 2025/26 academic year, undergraduate tuition fees for home students in England are capped at £9,535 per year, increasing from £9,250.  Fees in Wales, Scotland, and Northern Ireland for UK students generally match this, though, for Scottish students studying in Scotland, tuition is often free. International student fees are significantly higher, ranging from roughly £11,400  to over £67,000 annually.


Ref:  |  Universitiesuk.ac.uk  |  |  Student Loan Company (SLC) | 
|  UK Parliament  |  |  Education Act 1962  |

Overseas Students

In 2023/24 there were a reported  732,285 overseas students studying at UK higher education providers or 23% of the total student population. 75,490 of these students were from the EU,  and 656,795 from outside the EU. The total was down 4% from the 2022/23 record high. This was the first fall since 2012/13, but the 2023/24 figure was still the second highest ever number of overseas students.


Ref:  House Of Commons LibraryPDF
International Students In UK Higher Education(PDF)


96,000 Unemployed Recent Graduates In The UK

As of late 2025/early 2026, there are over 96,000 unemployed recent graduates in the UK each academic year, with some, or potentially more, analysis suggesting up to 400,000 to 700,000 total graduates (aged 16-64) are out of work and on benefits.

The  BBC reported that more than 700,000 university graduates are out of work and claiming welfare benefits. The introduction of tuition fees and the shift to a loan-based funding system for university students is frequently cited by critics as one of the most detrimental, long-lasting policies of Tony Blair’s Labour government. Beginning in 1998, this policy marked the end of nearly four decades of free higher education in the UK and initiated a cycle of   rising student debt.


Ref: | BBC |  | Guardian |


Approximately £50,000 Average Student Loan Debts 

Today graduates in England from the 2024/25 academic year face average student loan debts of approximately £53,000. This figure is significantly higher than other UK nations, driven by tuition fees and maintenance loans. While some students have debts exceeding £250,000, most owe over £50,000, with debts often treated as a long-term “graduate tax”.


Average Debt by UK Nation (2025 Data)

England: ~£53,000
Wales: ~£39,000
Northern Ireland: ~£28,000
Scotland: ~£17,000


Key Debt Factors
  • Rapid Growth:
    The average debt in England increased by 10% from roughly £48,270 in the previous year, with total outstanding loans reaching £267 billion by March 2025.
  • Repayment Structure:
    Only about 56% of full-time undergraduates starting in 2024/25 are forecast to repay their loans in full due to higher interest and longer repayment terms.
  • Loan Characteristics:
    For many, the debt is not a traditional loan but a “graduate tax,” with 9% of earnings above a threshold paid back for up to 30 or 40 years.
  • Highest Cases:
    Extreme cases exist, with some student debts in England exceeding £250,000, often resulting from multiple courses and accrued interest. 

Disclaimer Read More

The information provided on this site is for general informational purposes only and does not constitute professional advice. Use of any information is solely at your own risk. We also accept no responsibility or liability for the personal opinions published in views, blog posts, opinion pieces or articles that comprise opinion pieces.

Google Career Certificates

Google Career Certificates


Google Career Certificates

Introduction

Google Career Certificates are professional training programmes developed by Google to equip individuals with job-ready skills in high-demand fields, especially in the digital and technology sectors. These certificates are designed for people from all backgrounds, whether they are looking to start a new career, enhance their current skills, or change career paths entirely. Google provides 10,000 scholarships across the UK through their partners, Google.org grantees, and their networks.


Overview Of The Programmes

Google Career Certificates focus on several key areas within the digital world, such as IT Support, Data Analytics, Project Management, UX Design, Cybersecurity, and Digital Marketing & E-commerce. Each course is developed in collaboration with leading industry experts and employers to ensure the curriculum remains relevant and practical.


Who Can Benefit?

These certificates are ideal for those who do not have a traditional college degree or prior experience in the field. The courses are open to everyone and are particularly useful for career changers, recent graduates, or anyone wishing to upskill in the digital economy. The flexible, online nature of the courses means they can be completed around work or other commitments.


Structure And Delivery

  • Self-paced online learning, allowing students to progress according to their schedule.
  • Typically completed within three to six months, depending on the learner’s pace.
  • Courses feature a blend of video lectures, hands-on labs, quizzes, and practical assignments.
  • Offered on platforms such as Coursera, making them accessible globally.

Key Certificate Programmes
  • IT Support: Covers troubleshooting, customer care, networking, operating systems, system administration, and security.
  • Data Analytics: Teaches data cleaning, analysis, visualisation, and tools such as spreadsheets, SQL, and Tableau.
  • Project Management: Explores project planning, risk management, Agile and Scrum methodologies, and leadership skills.
  • UX Design: Focuses on user-centred design, prototyping, wireframing, and usability testing.
  • Cybersecurity: Introduces the fundamentals of network security, threat detection, and risk management.
  • Digital Marketing & E-commerce: Covers SEO, social media, email marketing, and online retail strategies.

Career Support And Outcomes

Google Career Certificates are recognised by a consortium of employers who value practical knowledge and real-world skills. Upon completion, learners can access resources such as CV/resume templates, interview tips, and job boards. Many graduates report increased job opportunities, higher earning potential, and successful transitions into new roles within months of earning their certificate.


Accessibility And Affordability

One of the key strengths of the Google Career Certificates programme is its commitment to accessibility. The courses are competitively priced, and financial assistance or scholarships may be available for those who qualify. This makes it easier for people from diverse backgrounds to enter the digital workforce without the barrier of significant upfront costs.

Costs for Google training in the UK vary from free to over £1,000 depending on the, type (official vs. third-party), depth, and format (online, in-person, or private). Free, self-paced learning is available through Google Digital Garage, while professional certificates (e.g., Coursera) often require monthly subscriptions (£35-£40+). Specialised third-party training, such as Google Ads or Cloud courses, ranges from £99 to over £1,000 per person.


Free & Paid  Digital Skills Training


Free Training:
G
oogle Digital Garage offers free digital skills training, and Google Cloud Skills Boost provides free initial credits.

Google Career Certificates: Typically cost around £30-£40 via Coursera, though free, sponsored, or scholarship-based access is often available through UK partners like the Prince’s Trust.

Google Cloud Digital Leader (Third-party): Online courses are priced around £99.00.

Google Ads & Marketing (Third-party):

  • Public Courses: Ranging from £350 to £550+ VAT for 1-day sessions.
  • Private/Corporate Training: £250–£550+ VAT for smaller sessions, increasing to £1,000+ for larger groups.
  • Specialised Technical Training (GCP): Intensive Google Cloud Platform (GCP) training can range from £850 to over £2,200 per user. 

Key Providers & Options:


Conclusion

Google Career Certificates provide a valuable, practical route into some of the most sought-after careers in tech and business. With their flexible learning model, employer recognition, and comprehensive career support, they are an excellent option for anyone seeking to gain relevant skills for the modern job market. It is worth considering  that more than 600,000 graduates are on benefits, and “Career Certificates training” is possibly a beter option than going to university.

With the high numbers of graduate unemployed, equiping individuals with job-ready skills apprenticeships offer ‘better financial outcomes’. Half of all graduates could have been financially better off if they had taken a higher-level apprenticeship, instead of a university degree, the think tank estimated.

  • Google   450+ Free certificates and badges on Android, cloud, analytics, digital marketing.
  • Microsoft  2,800 free courses on Azure, Office, AI, data science.
  • Amazon (AWS)   9,000 free online courses, over 720 with a free certificate or badge on all facets of AWS, including generative AI.
  • IBM 900+ free courses and around 60 free certificates on AI, machine learning, cloud computing.
  • LinkedIn 460+ hours of courses and learning paths offering free certificates on soft skills, entrepreneurship, management.
  • Meta several free mini-courses  prepare for Meta’s certifications on digital marketing, ads, engagement.
  • Salesforce 1,600 free modules, some with badges, on all facets of Salesforce, with a focus on admin, development, AI.
  • Twitter/X  200 free mini-courses, including 12 free certificates or badges on Twitter / X advertising…
  • GitLab  90 free mini-courses and a free certificate path to learn all facets of GitLab, CI, Gen AI
  • Mongo DB 140 free courses, from bite-sized courses to full learning paths on all facets of MongoDB
  • Cisco Networking 30+ free courses, many with badges, on cybersecurity, networking, AI, data science Academy

Disclaimer Read More

The information provided on this site is for general informational purposes only and does not constitute professional advice. Use of any information is solely at your own risk. We also accept no responsibility or liability for the personal opinions published in views, blog posts, opinion pieces or articles that comprise opinion pieces.

Google Shopping Product Feed

Google Shopping


Google Shopping Product Feed

A Comprehensive Guide For Retailers

Google Shopping is a powerful platform that enables retailers to showcase their products directly within Google Search and across the Google Shopping tab. To participate, retailers must submit a structured data file known as a “Product Feed” to Google Merchant Centre. This document provides a detailed overview of what a Google Shopping Product Feed is, its required components, and best practices for successful submission.


What Is a Google Shopping Product Feed?

A Google Shopping Product Feed is a file—typically in CSV, TSV, or XML format—that contains all the essential information about the products you wish to advertise on Google Shopping. Each row in the feed represents a single product, and each column (or field) contains a specific attribute, such as title, price, or availability.


Key Attributes In A Product Feed

Google requires certain attributes to be present in every product feed to ensure that listings are accurate and relevant. Below is a summary of the most important fields:

  • id: A unique identifier for each product (e.g., SKU).
  • title: The product’s name as you wish it to appear in Google Shopping results.
  • description: A clear, concise summary of the product.
  • link: The landing page URL where the product can be purchased.
  • image_link: The main image URL for the product.
  • availability: Current stock status (e.g., in stock, out of stock, preorder).
  • price: The product’s price, including currency (e.g., 29.99 GBP).
  • brand: The product’s brand or manufacturer.
  • gtin: Global Trade Item Number (if applicable).
  • mpn: Manufacturer Part Number (if GTIN is not available).
  • condition: Whether the item is new, refurbished, or used.
  • google_product_category: The most accurate category from Google’s taxonomy.

Optional But Recommended Attributes

  • sale_price: If the product is on sale, specify the discounted price.
  • additional_image_link: URLs for extra images of the product.
  • item_group_id: For variants (e.g., sizes or colours) of the same product.
  • shipping: Details about shipping costs and methods.

Feed Formats
  • CSV (Comma-Separated Values): Common and easy to edit in spreadsheet software.
  • TSV (Tab-Separated Values): Useful for data containing commas.
  • XML (Extensible Markup Language): Suitable for large or complex feeds, often generated automatically from e-commerce platforms.

Best Practices For Creating A Product Feed
  1. Ensure all required fields are accurately filled in for each product.
  2. Use high-quality product images and clear, descriptive titles.
  3. Keep your feed updated regularly to reflect changes in price, availability, or product information.
  4. Follow Google’s editorial and technical feed specifications to avoid disapprovals.
  5. Test your feed for errors before submitting to Google Merchant Centre.

Submitting Your Product Feed

Once your feed is ready, upload it to your Google Merchant Centre account. Google will process the feed, flag any errors, and make your products eligible to appear in Shopping ads and free listings.


Conclusion

A well-structured Google Shopping Product Feed is crucial for visibility and success on Google Shopping. By including all required attributes, following best practices, and keeping your information up to date, you can maximise the reach and impact of your product listings.


Disclaimer Read More

The information provided on this site is for general informational purposes only and does not constitute professional advice. Use of any information is solely at your own risk. We also accept no responsibility or liability for the personal opinions published in views, blog posts, opinion pieces or articles that comprise opinion pieces.

Rank Math Video Tutorial


Complete Rank Math Video Tutorial

This video introduces a WordPress SEO plugin with the features of many SEO and AI SEO tools in a single package to help multiply your SEO traffic.The video tutorial is over 2 1/2 hours. 

Rank Math is very popular and one of the fastest-growing WordPress SEO plugins, considered a strong competitor to Yoast SEO, with millions of active users, high ratings (around 4.9 stars), and praised for its extensive free features, though Yoast SEO still leads in sheer volume due to its earlier launch. Its popularity stems from offering a robust, user-friendly, feature-rich alternative that includes AI, keyword tracking, and Google Analytics integration, making it a favorite among bloggers and marketers.


Video Timestamps:
00:00 – Introduction
00:44 – Installing Rank Math SEO & Rank Math SEO PRO
00:57 – Installing Rank Math from the WordPress Repository
01:26 – Installing via upload (Rank Math PRO)
02:47 – Create Your Free Rank Math Account

03:22 – Rank Math Set-Up Wizard [How to access + Getting Started]
04:12 – Import from other websites (Business and Agency users)
04:48 – Basic settings [Your Site, Analytics, Sitemaps, Optimisation]
12:07 – Rank Math Set-Up Wizard – Advanced Options [Ready screen with button to access, Role Manager, 404 + Redirections, Schema Markup]


14:15 – SEO Analysis
15:51 – Basic SEO Analysis Tests
18:11 – Advanced SEO Analysis Tests
20:36 – Performance Tests
21:59 – Security Tests


22:58 – Rank Math Dashboard: Modules
24:17 – 404 Monitor
25:41 – Analytics
46:34 – Email Reporting
47:27 – Content AI
47:45 – Image SEO
50:02 – Instant indexing
51:44 – Link Counter
52:07 – Local SEO & Knowledge Graph
53:38 – Redirections
01:01:22 – Role Manager
01:04:04 – Schema (Structured Data)
01:07:14 – SEO Analysis
01:07:33 – Sitemap, Local Sitemap, News Sitemap, and Video Sitemap
01:19:06 – Modules that involve other plugins (ACF, AMP, bbPress, BuddyPress, Google Web Stories, and WooCommerce)
01:20:14 – Help tab in Rank Math’s Dashboard


Read More

01:21:06 – General Settings: Links
01:23:53 – Breadcrumbs
01:25:21 – Webmaster Tools
01:25:51 – Edit robots.txt
01:27:21 – Others
01:30:32 – WooCommerce
01:31:41 – Edit .htaccess
01:32:12 – Resetting Your Settings

Read More
01:32:52 – Titles & Meta
01:33:12 – Global Meta
01:38:12 – Local SEO
01:38:22 – Social Meta
01:39:17 – Homepage
01:39:47 – Authors
01:40:33 – Miscellaneous Pages
01:41:55 – Posts, Pages, Attachments, and custom post types
01:47:42 – Products
01:50:26 – Categories, tags, and custom taxonomies


Read More
01:51:21 – On-page SEO (Optimising Posts)
01:51:56 – Focus keyword
01:54:13 – Content AI
01:57:39 – Content Analysis
01:58:34 – Basic SEO
02:01:11 – Additional SEO
02:04:36 – Title Readability
02:05:45 – Content Readability
02:07:32 – Pillar Content
02:07:51 – Advanced tab
02:10:03 – Schema tab
02:14:26 – Social tab

Read More

02:15:56 – Status & Tools
02:16:11 – Version control
02:17:25 – Database Tools
02:23:10 – System Status
02:24:05 – Import & Export
02:27:00 – Conclusion


YouTube Channel REFERENCE SOURCES
Video: Rank Math Video Tutorial
Description: This video by Rank Math introduces a WordPress SEO plugin, with the features of many SEO and AI SEO tools in a single package.

Microsoft PowerPoint for Beginners


Microsoft PowerPoint For Beginners 

Learn everything you need to effectively use PowerPoint by watching just one video. You’ll learn the modern PowerPoint layout, how to create and save presentations, formatting options, creating and editing tables, creating charts and drawings, printing and publishing options, and more. After watching and mastering this video, you will be able to use PowerPoint effectively in almost any professional or educational setting.


Table Of Contents

00:00 – Introduction
00:21 – PowerPoint Layout & Creating and Editing
09:04 – Opening and Editing Presentations
14:39 – Formatting a Presentation
22:14 – Constructing a Table
25:44 – Creating a Chart
31:09 – Adding Objects to a Presentation
37:17 – Drawing in PowerPoint
40:59 – Refining a Presentation
47:03 – Printing or Exporting a Presentation
49:33 – Delivering a Presentation


Microsoft PowerPoint

Microsoft PowerPoint remains extremely popular, dominating the presentation software market with a massive user base (over 500 million) and high usage, with millions of presentations created daily, holding up to 95% market share and being a standard in business and education despite rivals like Google Slides gaining ground.


YouTube Channel: Technology for Teachers and Students :
Description: The channel is all about clear tutorials, helpful tips and tricks for teachers, and reviews of Educational Technology.
Subscribers: 1.8 Million  |  695 Videos
Author : A full time class teacher, part time trainer with a real interest in Educational technology and innovation.