New Homebuying Rules

UK Housing Shortage


New Homebuying Rules

On 6 October 2025, the UK Government launched a wide-ranging consultation to overhaul the home-buying and selling process. Around 1.2 million homes are sold each year in the UK, however it now takes an average of 120 days to complete a sale after an offer is accepted. 

Approximately 530,000  house sales fail each year in England and Wales, with around 31% of agreed sales falling through before completion, costing consumers over  £1.5 billion annually in wasted fees. These failed transactions are often due to broken chains, mortgage issues, or gazumping, with roughly 73% of failures caused by buyers pulling out.

The UK government is reforming the home-buying process to make it faster, cheaper, and more transparent, aiming to reduce transaction times by four weeks and halve failed sales. Key proposals include mandatory upfront information from sellers, digital property logbooks, and potential early binding contracts to stop parties from pulling out.


Key Differences in Wales (vs. UK/England):

Home buying in Wales largely follows the same legal, conveyancing, and mortgage processes as England. The primary difference is that Wales uses Land Transaction Tax (LTT) instead of Stamp Duty, with higher zero-rate thresholds (£225,000) and no specific first-time buyer relief, often resulting in lower tax for mid-range properties but different costs for others.

Land Transaction Tax (LTT) :  Replaced Stamp Duty in 2018, managed by the Welsh Revenue Authority.

Tax Thresholds: No LTT is paid on properties up to £225,000 (as of 2025), whereas English Stamp Duty begins at £125,000 or £250,000 depending on rules.

First-Time Buyers: Unlike England, there is no universal first-time buyer exemption, although many lower-priced homes fall into the zero-rate band.

Second Homes:  Higher rates of LTT apply to additional property purchases (second homes/buy-to-lets), with rates increased in December 2024.

Tax Deadline: LTT returns and payments must be submitted within 30 days of completion. (gov.wales +4)


Similarities:

Process: The, conveyancing, surveying, and pre-contract stages are virtually identical to England.

Binding Contracts: Contracts are only legally binding upon exchange, allowing for gazumping or pulling out prior to that stage.  Ref:  Property Checker 


Important Considerations:

LTT Calculator: Always use a specific Welsh LTT calculator, as English Stamp Duty calculators will give incorrect figures.
Higher Rates: If buying an additional property (e.g., a holiday home), expect significantly higher, specialized LTT rates.

Future Divergence:
 Welsh property law is undergoing further changes that may increase, causing further divergence from English procedures.

Disclaimer: Tax rates and thresholds are subject to change by the Welsh Government. Always confirm with a legal professional.


For Home Buyer

Key effects of the proposed reforms for home buyers and sellers include:

Reduced Initial Costs:  First-time buyers could save an average of £710 on transaction costs due to the requirement for upfront information, such as surveys, to be provided by the seller.

Greater Transparency:  Buyers will have access to material information—including flood risks, planning permissions, leasehold details, and property condition reports—before making an offer, reducing the risk of hidden issues surfacing late in the process.

Reduced Risk of Gazumping: The introduction of optional “binding contracts” at an earlier stage aims to prevent sellers from accepting higher offers after a sale has already been agreed.

Faster Process: The use of digital property logbooks and digitized, upfront information is expected to speed up the conveyancing process, reducing the average time from offer to completion.


For Home Sellers

Increased Upfront Costs: Sellers and estate agents will be required to provide “material information” upfront, which may cost them approximately £310 more at the start of the selling process.

Lower Risk of Sale Falling Through:
 Although upfront costs are higher, the government argues that providing more information will reduce the likelihood of sales collapsing, which currently costs sellers an average of £800 in failed transactions.

Improved Marketing: Upfront surveys and search information allow homes to be marketed with more credibility, potentially attracting more serious buyers.  


Broader Market Effects


Regulation of Agents: 
A new mandatory “Code of Practice” for estate agents and conveyancers will be introduced to increase professional standards and trust in the industry.

Digital Transformation:  The reforms emphasize the use of digital tools like Property Logbooks and digital ID verification, reducing the reliance on paper-based, slower methods.

Potential for Increased Activity: By making the process more certain and reducing the risk of gazumping, the government aims to boost confidence in the market, encouraging more people to buy and sell.

Comparison Data: The government plans to publish performance data on estate agents and property lawyers, allowing consumers to choose professionals based on their track record.  

These reforms are part of a wider housing strategy that also includes building 1.5 million new homes and reforming the leasehold system.


Ref: | Yahoo Finance UK BBC | Money Saving Expert | Stamp Duty Calculator


The information provided on this site is for general informational purposes only and does not constitute professional advice. Use of any information is solely at your own risk. We also accept no responsibility or liability for the personal opinions published in views, blog posts, opinion pieces or articles that comprise opinion pieces.


Record High Active Companies

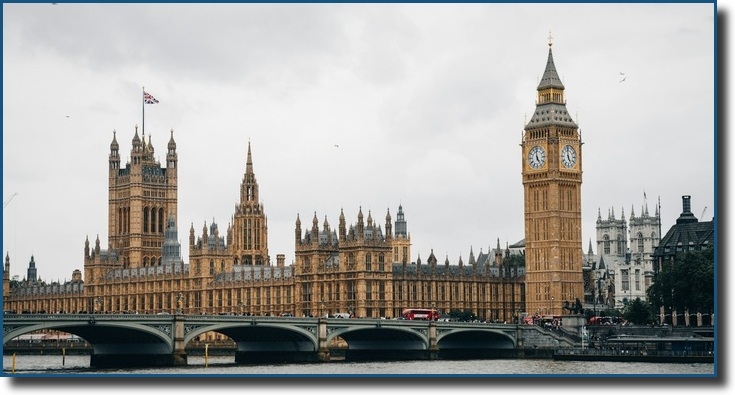
Houses Of Parliament


Over 5 Million Active Companies

Labour with a 33.7 % vote share became a commanding parliamentary majority, even though two-thirds of the electorate did not vote for the party. Following their landslide victory in July 2024, the Labour government moved quickly to introduce a sweeping agenda of reforms within their first 100 days, aiming to “turn the page” on 14 years of Conservative governance. While some reforms were immediate, many were designed as part of a “phased approach” to be fully implemented over the coming years.

In 2024, there was a record high of over 5.6 million active companies in  the UK, with roughly 846,000 new businesses launched during that year. While business births fell slightly in 2023 to around 316,000-337,000, new business activity remained strong, with London leading and sectors like property and food services growing.


200,000 Businesses Closed

More than 200,000 businesses have closed since Rachel Reeves was put in charge of the British economy. That’s more than 770 a day . Based on data from early 2025, over 200,000 businesses in the UK reportedly folded or closed since the Labour government assumed power in 2024, amid concerns regarding tax policies. Reports indicate a challenging environment for SMEs, with roughly 83,425 closures in Q1 2025 alone and significant insolvency notices.


2025 16,500  Millionaires Left The  UK

Provisional data from the Henley Private Wealth Migration Report 2025 indicates a record-breaking net loss of approximately 16,500 of millionaires from the UK in 2025, the highest globally. This departure represents roughly 1% of the UK’s high-net-worth individual population, driven by tax changes, political uncertainty, and the abolition of non-dom status.

The UK abolished the long-standing non-domiciled (non-dom) tax regime effective April 6, 2025, replacing it with a new residence-based system. From this date, all UK residents, regardless of domicile status, are taxed on their worldwide income and gains as they arise. The new regime offers a 4-year foreign income and gains (FIG) exemption for new arrivals.


Key Details Regarding The Record High Include:

Sector Growth: Property businesses saw the largest increase (+38%), followed by takeaway shops and food stalls (+14%), and management consultancy firms (+11%).

Incorporations: The first quarter of 2024 saw the highest number of new company formations in five years, with 248,000, though this figure dropped to 184,000 by Q4.


E-commerce: Despite a slight decline, retail via mail order or the internet remained a top sector for new incorporations.

Previous Record: The 2024 figures surpassed the previous record of 5.31 million active companies set in 2023.

High Number Of Business Closures

Since the Labour Party took power in July 2024, the UK business landscape has seen a high number of closures, particularly within the retail, hospitality, and manufacturing sectors. Data up to early 2025 indicates a significant, and in some sectors accelerating, trend of insolvencies, with over 13,000 high street shops closing in 2024.

Below are the types of businesses and specific examples of firms that have shut down, restructured, or entered administration since July 2024:

1. Retailers and High Street Stores

Retail has been heavily impacted by high operating costs and inflation, with 2025 predicted to see as many as 17,350 further shop closures.


Major Retail Chains: Homebase (65 outlets shuttered in 2025), Ted Baker (all 46 UK stores closed), The Body Shop (significant restructuring/closures), Carpetright (collapsed, closing most stores).

Independent Shops:
Over 11,000 independent retailers closed in 2024, representing a 45.5% jump in failures.

Other Retailers:
  Poundland (multiple store closures), Clarks (closures throughout 2024), Morphe (closed 7 UK stores), and The Works (selected branch closures).

Supermarkets/Convenience:
Morrisons (closed 17 smaller convenience stores, along with in-store cafes and counters).


2. Hospitality, Pubs, and Leisure

Hospitality has suffered, with rising National Insurance, wage increases, and reduced business rate relief cited as major factors.

  • Pubs: Over 400 pubs closed in England and Wales in 2024, with the total number falling below 39,000.
  • Restaurants: TGI Fridays (entered administration in Sept 2024), Wildwood (closed 14 branches), Yo! Sushi (closed several sites to move toward a kiosk model).
  • Nightclubs: Rekom (operator of Pryzm and Atik, closed 17 venues).
  • Hotels: Maidstone Mercure Hotel was added to a list of closures.

3. Construction and Manufacturing

The manufacturing sector has been affected by high energy costs and restructuring.

  • Construction: ISG (the UK’s 6th biggest construction firm) collapsed in late 2024, resulting in thousands of job losses.
  • Manufacturing:  Hotpoint (closed a Bristol factory, 140 jobs lost), Speyside Distillery (closed in late 2024), Earle Group (tile-maker, four companies in administration).
  • Specialised Manufacturing:  Reports of local closures including a bra manufacturer, food blender manufacturer, and a dog kennel.

4. Other Sectors
  • Banking: 441 banks closed in 2024, restricting services for those without internet access.
  • Charity: Hundreds of charity shops have reported difficulties, with many shutting down in 2025.
  • Logistics: Getir (grocery delivery firm) pulled out of the UK market, costing over 1,500 jobs.
  • Service & Retail: Claire’s Accessories (collapsed into administration, Aug 2025).

Key Drivers of Closures

Industry experts have linked these closures to several factors, including:

  • Autumn Budget 2024 Measures: Increases in Employers’ National Insurance contributions (from 13.8% to 15%) and the reduction of business rates relief.
  • National Minimum Wage Increase: A 6.7% increase (to £12.21/hour) placing pressure on high-staffing sectors.
  • Cost-of-Living Crisis: Reduced consumer spending impacting revenue.
  • Shift to Online Shopping: Continued decline in traditional high-street footfall.

Note: While some sources indicate a surge in insolvencies, others report that on an annual basis, the 2024 “death rate” of businesses was the lowest since 2016, with 280,000 closing against 317,000 opening.


Ref: | The House of Commons Library | Ref: UK Parliament.Forbes Burton  | Antony Batty | ONS |   Companies House Henley Private Wealth | Migration Report 2025


The information provided on this site is for general informational purposes only and does not constitute professional advice. Use of any information is solely at your own risk. We also accept no responsibility or liability for the personal opinions published in views, blog posts, opinion pieces or articles that comprise opinion pieces.

4.3 Million Missing Homes

UK Housing Shortage


UK Back Log Of 4.3 Million Missing Homes

A report by the Centre for Cities indicates the UK has a backlog of 4.3  to 6.5 million  missing homes compared to the average Western European country. This significant deficit represents a 15% increase in required housing stock, with roots in planning restrictions dating back to 1947. This shortage is considered the main driver of the UK’s housing crisis. 

Reports indicate that the UK has a significant housing backlog compared to comparable European countries. This backlog is considered a “missing” supply built up over decades due to lower construction rates than European neighboors, particularly since the 1950s. 

The UK often fails to meet its house building targets. Estimates suggest a substantial increase in annual new home construction is needed for England to reach the housing density of its OECD peers.

The UK population however, grew by 755,300 (1.1%) in the year to mid-2024, one of the largest annual increases in over 75 years (Office for National Statistics)


1.3 Million Households Are On Social Housing Waiting Lists

England faces a severe, long-term housing shortage driven by a failure to meet building targets and rapid population growth, this crisis has made homeownership, particularly for young people, increasingly unattainable, with property prices rising 318% since the 1970s while wages only grew by 94%. Over 1.3 million households are on social housing waiting lists across England. Due to a chronic shortage of affordable housing, families face an average wait of five and a half years. Simultaneously, over 354,000 people are believed to be homeless, including those in temporary accommodation.


England’s Severe Housing Shortages

England is frequently cited as having one of the most severe housing shortages among developed nations. Housing costs, constitute a larger portion of household spending in the UK than in most other OECD countries.  Recent data shows a decrease in total housing completions, and a significant drop in new home registrations in London.


Old UK Housing Stock

The UK’s housing stock is among the oldest in the developed world, with a large percentage of homes built before 1980. With a significant portion of homes built over a century ago.  Approximately 38% of UK homes were built before 1946, a higher proportion than any other European country.

Roughly 15-20% of homes in England and Wales were built before 1919, leading to significant energy efficiency challenges, with many properties falling below EPC band C. Older, solid-wall homes, particularly in London and Wales, often require extensive maintenance compared to newer, more efficient builds.

A significant number of homes in England also do not meet the “Decent Homes Standard”. The UK often fails to meet its house building targets. Estimates suggest a substantial increase in annual new home construction is needed for England to reach the housing density of its OECD peers.


England Worst Place In The Developed World To Find Housing

England is reported as the worst place in the developed world to find housing. The UK has historically built fewer homes per 1,000 inhabitants than countries like France, Germany, or the Netherlands, leading to a significant accumulated housing deficit. OECD nations data often places the UK among the bottom in the OECD for housing stock growth.

Had the UK built houses at the same rate as the average Western European country between 1955 and 2015, it would have 4.3 million more homes. If the UK continues at current building rates, it will take over 50 years to address the backlog. The United Kingdom’s population was estimated to be 69.3 million in mid-2024, reflecting a significant increase driven largely by international migration. The population is projected to reach 72.5 million by mid-2032 and 76.6 million by 2047, alongside an aging demographic. 

England has a significantly lower number of dwellings per 1,000 inhabitants (around 434) compared to the OECD average of approximately 487. This is also lower than comparable nations like France, Italy, and the Netherlands.


Key Aspects Of The Missing Homes Crisis

  • Comparison Basis:  Had the UK built houses at the same rate as the average Western European country between 1955 and 2015, it would have 4.3 million more homes.

  • Cause: Inefficient post-war planning systems, particularly the 1947 Town and Country Planning Act, have hindered development.

  • Scale: The 4.3 million figure is considered conservative, with some estimates even higher, placing the shortage above the total number of dwellings in London.

  • Previous Estimates: This 4.3 million figure aligns with, or exceeds, other assessments of the housing crisis, such as the 3.9 million missing homes calculated by Crisis in 2015.

  • Impact: The lack of homes drives up housing costs and contributes to economic disparities.

  • Geography: The shortages are most acute in the South East, where high-demand, prosperous cities often build less, according to Centre for Cities.

  • Underbuilding History: The crisis is not solely recent; roughly 1.2 million, or 29% of the missing homes, were lost to low construction rates between 1955 and 1979. The government has previously set targets to build 300,000 homes a year, but these are insufficient to rapidly close the gap, notes Centre for Cities.

  • Proposed Solutions: Proposed solutions include extensive planning reforms, such as introducing a zone-based system to increase housing supply. The Centre for Cities recommends replacing the discretionary planning system with a rules-based, flexible zoning system to address the deficit. The report notes that addressing this backlog is essential, as the UK has one of the most difficult housing markets in the developed world to navigate.

The information provided on this site is for general informational purposes only and does not constitute professional advice. Use of any information is solely at your own risk. We also accept no responsibility or liability for the personal opinions published in views, blog posts, opinion pieces or articles that comprise opinion pieces.


Home Buying And Selling Reform

UK Housing Shortage


Home Buying And Selling Reform

The Labour government has proposed major reforms to the home buying and selling process in England and Wales, aiming to reduce transaction times by four weeks, halve failed sales, and save buyers an average of £710. Key proposals include mandatory upfront information, digital logbooks, and potential earlier binding contracts.

The UK government previously aimed to increase the housing stock by 300,000 new homes per year to address the ongoing shortage.  As of 2023–2025, there are approximately 30.4 million homes in the UK. This total includes roughly 28.4 million households. Despite this, the country faces a significant housing shortage, with some estimates suggesting a deficit of 4.3 million homes compared to other European counterparts.


4.3 Million Missing Homes 

A 2023 report by the Centre for Cities indicates the UK has a backlog of 4.3 million missing homes compared to the average Western European country. This significant deficit represents a 15% increase in required housing stock, with roots in planning restrictions dating back to 1947. This shortage is considered the main driver of the UK’s housing crisis.


Key Aspects of the Proposed Reform 

Upfront Information: Sellers and agents must provide essential information (condition, leasehold costs, chain details) before marketing.

Digital Tools:
Increased use of digital property logbooks and ID verification to speed up conveyancing.


Binding Contracts
: Introduction of options to make agreements legally binding earlier to reduce ‘gazumping’ and late, failed transactions.


Agent Regulation:
Mandatory qualifications and a strict code of practice for estate and letting agents.

Targeted Savings: While first-time buyers could save an average of £710, it is noted that sellers at the end of chains might face higher initial costs.

Additionally, in February 2026, the government began exploring a potential new “Help to Buy” scheme to support first-time buyers with low deposits, as reported by The Telegraph.


England

As of Census 2021, there were over 1.5 million unoccupied dwellings in England (6.1% of all stock) and 120,450 in Wales (8.2%), including vacant homes and second homes. Long-term empty homes in England rose to 261,189 by late 2023 . Major concentrations exist, with London having the highest percentage of unoccupied dwellings.

At least 382,000 people were homeless in England as of late 2025, a figure including a record number in temporary accommodation (over 350,000) and rough sleepers (around 4,667 on a single night in Autumn 2024), though hidden homelessness (sofa surfing, cars) means the true number is higher. The number of households in temporary housing and rough sleeping has significantly increased in recent years, driven by factors like housing shortages and rising rents.


Scotland

As of 2024, Scotland has approximately 2.74 million dwellings (homes), with about 2.55 million of those being occupied households, according to National Records of Scotland and Aberdeenshire Council estimates, showing a consistent increase over the past two decades. The majority are owner-occupied, with significant portions also being social or private rentals, and a smaller percentage as vacant or second homes. 

In Scotland there were 40,688 homelessness applications recorded in 2024-25. · There were 31,695 open homelessness cases  as of  31 March 2025.


Wales

As of late 2025, homelessness in Wales remains high, with approximately 157–160 people sleeping rough as of September/October and over 10,800 individuals in temporary accommodation. While rough sleeping decreased slightly from late 2024 (173 people), over 13,000 households required support between April 2024 and March 2025.

As of early 2021, there were approximately 120,450 unoccupied dwellings in Wales, comprising 102,875 vacant properties and 17,575 second homes. Local authorities in Wales are actively tackling this issue by offering grants of up to £25,000 to renovate empty homes, along with interest-free loans to bring properties back into use.

In 2025, Wales continues to tackle high numbers of unoccupied dwellings and second homes by enabling local authorities to charge council tax premiums of up to 200% on long-term empty properties. The Welsh Government has extended the National Empty Homes Grant scheme to September 2026 to bring these properties back into use.


Regional Breakdown:

There were 26.4 million dwellings in England and Wales as of 2021, with 24.9 million in England and 1.5 million in Wales. Scotland has approximately 2.74 million dwellings (homes).

Housing Type & Age:

The UK has one of the oldest housing stocks in Europe, with 38% of homes built before 1946. In 2021, 21.7% of households were in a flat, maisonette, or apartment. The Government estimates that 300,000 new homes are needed per year.

Ownership & Tenure:

In 2023-24, owner-occupation accounted for 16 million households in England (65%), while the private rented sector accounted for 4.7 million (19%).


Unoccupied Dwellings

In 2021, there was a reported, 1.5 million unoccupied dwellings in England and over 120,450 in Wales. Including vacant homes and second homes. Long-term empty homes in England rose to 261,189 by late 2023. Major concentrations exist, with London having the highest percentage of unoccupied dwellings.

As of early 2026, estimates for empty homes in London vary, with some reports indicating nearly 300,000 to over 300,000 properties are either long-term empty, used as second homes, or not in primary use. Recent data shows a rise in vacant properties, with 93,602 homes recorded as empty and over 38,000 classified as long-term vacant as of 2025.


The information provided on this site is for general informational purposes only and does not constitute professional advice. Use of any information is solely at your own risk. We also accept no responsibility or liability for the personal opinions published in views, blog posts, opinion pieces or articles that comprise opinion pieces.


Teaching and Learning Courses

Supporting Teaching & Learning Courses

Supporting Teaching and Learning (STL) courses, often at Levels 2 and 3, are qualifications for individuals working or volunteering as teaching assistants or learning support staff in schools and colleges. They provide essential training in safeguarding, child development, classroom management, and supporting lesson delivery. These courses, often available via local colleges or online providers, typically require a practical school placement.

As of the November 2024 school workforce census, there are approximately 288,800 full-time equivalent (FTE) teaching assistants employed in state-funded schools in England. This number represents a significant increase in support staff, with around two-thirds of these roles working within primary schools.

As of November 2024, there were 14,675 teaching assistants (50.2% of support staff) employed in local authority-maintained schools in Wales. When including higher-level teaching assistants (HLTAs) and ALN support staff, the number of classroom-focused support staff is higher, within a total of 29,250 school support staff.

Teaching assistants (TAs) in the UK typically earn between £19,000 and £26,000 annually for full-time roles, with starting salaries around £19,000–£22,366. Experienced TAs or Higher Level Teaching Assistants (HLTAs) can earn up to £29,000–£45,000+. However, many TAs work term-time only, often resulting in actual take-home pay between £13,000 and £15,000.


Key Aspects Of STL Courses Include:

Levels And Focus:

Level 2:
Focuses on foundational knowledge for classroom support.

Level 3: Aimed at those looking to upskill, offering deeper, more technical knowledge of supporting learning, assessment, and special needs (SEND).


Core Topics:

Supporting Learning: Assisting with lesson planning, delivery, and assessment alongside teachers.
Child Development: Understanding children’s development, behaviour, and communication.
Safeguarding: Understanding policies for protecting children and young people.
Professional Development: Reflective practice, promoting equality, and fostering positive relationships.


Delivery And Requirements:

Placement: Usually requires a school placement (often one to two days per week).
Assessment: Coursework, projects, and practical assessments within the workplace.
Entry: Generally for those 19+ with relevant, albeit sometimes voluntary, experience.

These courses are nationally recognised qualifications, such as NCFE CACHE or City & Guilds, providing a pathway for career advancement in education.


Teaching Assistants (TAs)

Teaching assisants typically progress through four main levels of qualification and responsibility, ranging from general classroom support (Level 1) to higher-level, specialised roles (Level 4 or 5). These levels define the scope of support provided to teachers and students, with higher levels involving more specialised knowledge and increased responsibility, such as covering classes or leading interventions.

  • Level 1: Focuses on basic classroom support, such as helping with preparation, setting up resources, and supporting general learning.
  • Level 2: Involves more direct interaction, such as supporting individual students, working with specific groups, and assisting with Special Educational Needs (SEN).
  • Level 3: This is often considered the standard, fully qualified level, where TAs have a deeper understanding of child development and can take on more independent responsibilities, including planning support activities.
  • Level 4 / HLTA: Known as Higher Level Teaching Assistants (HLTA), these professionals often cover classes, lead specific interventions, and have higher-level expertise.
  • Level 5: Some specialised roles or advanced qualifications, such as senior SEN support or intervention coordinators, can reach this level.

Costs Of Courses

Many teaching assistants start at level 2 or 3 and progress to become HLTAs over time, with training often taking the form of apprenticeships or specific qualifications.  Teaching Assistant (TA) qualification costs vary by level and provider, generally ranging from approximately £200 to over £1,400 for accredited online courses. Level 2 certificates typically cost £300–£700, while more advanced Level 3 Diplomas cost £500–£950, with many providers offering payment plans. Some introductory courses are available for as low as £19–£50.


WordPress Image Gallery Plugin

Buy Learn English Activity Books: Speak English Write English


Costs for Teaching and Learning courses in the UK, such as Post Graduate Certificate in Education (PGCE) or Initial Teacher Training (ITT), typically range from £7,335 to £9,790 per year for UK applicants, with non-UK citizen fees averaging around £15,000 per year.

Shorter, specialised courses like the Level 3 Award or Level 4 Certificate in Education and Training often range from £270 to £599. Completely online.  Level 3 Award in Education and Training (PTLLS).  No previous experience needed. Qualifications regulated by OFQUAL. You can Enrol instantly and start today. Level 3 Award in Education and Training (PTLLS)


Key Costs By Qualification Level

Level 2 Certificate (Basic): £300 – £700, with some online options as low as £219.
Level 3 Diploma (Standard): £500 – £950. A popular option is to pay a deposit (e.g., £47.50) followed by monthly installments.
Level 4 (HLTA – Higher Level): £500 – £1,400.

Alternative Routes: Some courses are advertised as free, though these may be introductory or, in some cases, funded via government schemes.


Additional Considerations
  • Duration: Courses can take up to 2 years to complete if mixed with on-the-job training.
  • Provider Differences: eLearning College offers free, unaccredited courses, while The Learning College offers accredited, paid options.
  • On-the-job Training: Some schools provide training, allowing for employment without upfront qualification costs.

NOTES

PTLLS
stands for Preparing to Teach in the Lifelong Learning Sector, an introductory teaching qualification in the UK that has now been replaced by the Level 3 Award in Education and Training (AET), but the acronym is still commonly used.

It’s a foundational qualification for individuals wanting to teach adults in colleges, workplaces, or community settings, focusing on planning and delivering training without needing prior teaching experience.


Global Financial Crisis Timeline

2008 Financial Crisis


Global Financial Crisis Timeline

The 2008 financial crisis, also known as the global financial crisis (GFC) or the Panic of 2008, was a major worldwide financial crisis centered in the United States. The 2008 financial crisis was a global economic shock triggered by the collapse of the U.S. housing bubble, leading to bank failures, a freeze in credit markets, and the deepest recession since the 1930s.

The causes included excessive speculationon property values by both homeowners and financial institutions, leading to the 2000s United States housing bubble. It reshaped financial regulation worldwide and had lasting effects on jobs, housing, and government policy.

The 2007-2008 Global Financial Crisis caused the deepest recession in the UK since WWII, shrinking the economy by over 6% and causing a five-year recovery period. It triggered bank bailouts (e.g., Northern Rock, RBS), a, collapse in housing markets, increased household debt, and a sustained, long-term decline in productivity.


🌍 What It Was

  • A severe worldwide financial meltdown beginning in 2007–08, rooted in the U.S. housing market.
  • Often called the Global Financial Crisis (GFC) or Great Recession.
  • Triggered by rising mortgage defaults, collapsing banks, and a sudden loss of confidence in financial markets.

🏠 Core Causes

1. The Housing Bubble

  • Years of rapidly rising home prices encouraged by cheap credit and speculation.
  • Borrowers—including many with poor credit—were given mortgages they couldn’t afford.

2. Subprime Lending

  • Banks issued risky mortgages to high‑risk borrowers.
  • These loans were bundled into complex financial products and sold globally.

3. Low Interest Rates

  • The U.S. Federal Reserve cut rates from 6.5% to 1.75% (2000–2001), making borrowing extremely cheap and fueling the bubble.

4. Excessive Risk‑Taking

  • Financial institutions took on huge leverage and invested heavily in mortgage‑backed securities.
  • Regulators failed to keep pace with the complexity and scale of these products.

💥 Key Events

Year Event
2006 U.S. home prices begin falling.
2007 Subprime lenders and hedge funds collapse; global credit markets freeze.
2008 Lehman Brothers files for bankruptcy—the largest in U.S. history.
2008–09 Governments worldwide issue bailouts and stimulus packages.

📉 Global Consequences

Economic Impact

  • Deep recession across the U.S., UK, and Europe.
  • Massive job losses and business closures.
  • Sharp declines in stock markets and household wealth.

Impact in the UK (including Wales)

  • UK banks like RBS and Lloyds required government bailouts.
  • House prices fell sharply, affecting homeowners across Cardiff and the wider UK.
  • Austerity measures followed, shaping UK public spending for a decade.

Consumer Confidence Collapse

  • People cut back on spending, worsening the downturn.

🏛️ Government Responses

  • Bank bailouts to prevent systemic collapse.
  • Stimulus packages to revive economic activity.
  • Regulatory reforms, including the U.S. Dodd‑Frank Act, to reduce future risk.

🧭 Why It Still Matters
  • It reshaped modern banking regulation.
  • It influenced political and economic trends throughout the 2010s.
  • It changed how households view debt, housing, and financial risk.

📅 Timeline Of The 2008 Financial Crisis

2000–2003: Foundations of the Crisis

  • Central banks, especially the U.S. Federal Reserve, keep interest rates very low.
  • Cheap borrowing fuels a housing boom.
  • Banks begin issuing more subprime mortgages (loans to risky borrowers).

2004–2006: Housing Bubble Peaks

  • House prices surge to record highs.
  • Financial institutions aggressively package mortgages into mortgage‑backed securities (MBS) and CDOs.
  • Regulators fail to keep up with the complexity and risk.

2006: The Turning Point

  • U.S. housing prices start falling for the first time in years.
  • Borrowers begin defaulting on adjustable‑rate mortgages as payments rise.

2007: Early Cracks Become Visible

  • Major U.S. subprime lenders collapse.
  • Two Bear Stearns hedge funds fail due to exposure to mortgage securities.
  • Global credit markets tighten as banks lose trust in each other.
  • The term “credit crunch” enters the mainstream.

March 2008: Bear Stearns Collapse

  • Bear Stearns, one of the largest investment banks, faces a liquidity crisis.
  • It is sold to JPMorgan Chase in a government‑backed rescue.

September 2008: The Breaking Point

This is the month everything unravels.

September 7

  • U.S. government takes over Fannie Mae and Freddie Mac, two huge mortgage guarantors.

September 15

  • Lehman Brothers files for bankruptcy, the largest in U.S. history.
  • Global markets panic.

September 16

  • AIG, one of the world’s biggest insurers, is bailed out to prevent collapse.

Late September

  • Stock markets plunge worldwide.
  • Banks stop lending to each other, freezing global credit.

October 2008: Global Response

  1. Governments in the U.S., UK, and Europe announce massive bank bailouts.
  2. In the UK: The government rescues RBS, Lloyds, and HBOS.
  3. This becomes one of the largest state interventions in UK financial history.

2009: The Great Recession

  • Unemployment rises sharply across the U.S. and Europe.
  • Businesses close, consumer spending collapses.
  • Governments launch stimulus packages to revive their economies.

2010–2012: Aftershocks

  • Europe enters a sovereign debt crisis, especially in Greece, Spain, and Portugal.
  • New regulations emerge:
  • Dodd‑Frank Act in the U.S.
  • Stricter capital requirements for banks globally.

2013–2015: Slow Recovery

  • Housing markets stabilise.
  • Stock markets recover, but wage growth remains weak.
  • Austerity policies in the UK reshape public spending for a decade.

The information provided on this site is for general informational purposes only and does not constitute professional advice. Use of any information is solely at your own risk. We also accept no responsibility or liability for the personal opinions published in views, blog posts, opinion pieces or articles that comprise opinion pieces.


2008 Financial Crisis

2008 Financial Crisis
Deregulation In The Financial Industry

On 15 September 2008 the investment bank Lehman Brothers collapsed, sending shockwaves through the global financial system and beyond. The 2008 financial crisis, also known as the global financial crisis (GFC) or the Panic of 2008, was a major worldwide financial crisis centered in the United States. The causes included excessive speculation on property values by both homeowners and financial institutions, leading to the 2000s United States housing bubble. 

  • Deregulation in the financial industry
  • Permitted banks to engage in hedge fund trading
  • Banks demanded more mortgages
  • Created interest-only loans affordable to subprime borrowers

Key Aspects Of This Era Included:

Reckless Lending:  Loans were approved with little to no documentation of income or assets, often described as a “Wild West” atmosphere where anyone could get a loan.

Subprime & Option ARMs:  Subprime mortgages and Option ARMs were heavily used, leading to borrowers being underwater when the market crashed.

Impact: The crisis resulted in over 2 million home repossessions in the US and a global credit crunch.

Zombie Mortgages:  Residual, long-forgotten second mortgages from this era are currently resurfacing as debt collectors seek to foreclose on homes, a practice noted in 2025.


USA Crashed The  World’s Housing Market

While some professionals argued that buyers and lenders shared responsibility for excessive debt, the era is widely recognised for a lack of oversight. The USA “crashed” the world’s housing market primarily through the 2007-2008 subprime mortgage crisis, which triggered the Global Financial Crisis (GFC).

This was not a localised event, but a systemic collapse driven by toxic financial products that infected global banking institutions, leading to a deep, worldwide recession. The 2008 financial crisis, initiated by the collapse of the United States housing market, is widely recognised as a primary catalyst for a global recession that destroyed trillions of dollars in wealth.

While the crisis stemmed from widespread risky mortgage lending, complex financial derivatives, and inadequate regulation in the U.S., accountability for the key actors involved was notably sparse.   The causes included excessive speculation on property values by both homeowners and financial institutions, leading to the 2000s United States housing bubble. This was exacerbated by predatory lending for subprime mortgages and by deficiencies in regulation.

During the 2008 financial crisis, roughly 1.6 million people in the U.S. used homeless shelters or transitional housing programs, with approximately 664,000 individuals found to be homeless either sheltered or unsheltered—on a single night in January 2008. The crisis, which caused immense housing instability, saw a 9% rise in family homelessness and a 5% increase in “doubled-up” households.

On February 17, 2009, Obama signed into law the American Recovery and Reinvestment Act of 2009, a $787 billion economic stimulus package aimed at helping the economy recover from the deepening worldwide recession.


Here Is How The USA Housing Bubble 

Caused A Global Collapse:

1. The Creation of Toxic Assets (Subprime Mortgages)

Loose Lending Standards: In the early 2000s, US lenders, driven by high demand for mortgage-backed securities, relaxed lending standards, approving “subprime” loans for borrowers with poor creditworthiness.

“Originate-to-Distribute” Model: 
Banks no longer held the loans they made. Instead, they bundled thousands of these high-risk mortgages into Mortgage-Backed Securities (MBS) and Collateralised Debt Obligations (CDOs), which were sold to investors globally.

False Ratings: These complex, opaque securities were often rated as safe (AAA) by credit rating agencies, creating a false sense of security for investors.


2. The Bursting Bubble

Falling Prices & Defaults: When US housing prices peaked in 2006 and began to fall, homeowners with adjustable-rate mortgages could not refinance, and defaults skyrocketed.

Loss of Value: 
As defaults spread, the value of the MBS and CDOs held by banks worldwide plummeted, destroying trillions in wealth.


3. Global Contagion

Bank Failures: Banks in the US and Europe, having heavily invested in these toxic, worthless assets, faced immense losses, leading to a freeze in credit markets.

The Lehman Brothers Collapse: The collapse of Lehman Brothers in September 2008 triggered a global panic, forcing governments worldwide to step in to prevent a total banking system meltdown.

Severe Impact on Foreign Markets: The crisis spread to countries like the UK, which saw a 15% drop in house prices and a sharp, severe reduction in housing transactions.


4. Contributing Factors

Global Savings Glut: A massive influx of foreign capital (from China, Asia, and oil-exporting nations) into the US housing market fueled the bubble.

Deregulation: Lax regulation of financial institutions, specifically in the shadow banking system, allowed risky, complex products to be sold without proper oversight.

Federal Reserve Policy: Low interest rates in the early 2000s encouraged borrowing and fueled the housing bubble.


5. The US Sold Toxic Financial Products 

In summary, the US exported its housing crisis through the sale of toxic financial products, turning a localised real estate slump into a global economic disaster that caused severe, long-lasting damage to housing markets and financial institutions worldwide.

The argument that accountability was largely absent is supported by the fact that despite the massive economic fallout, almost no high-level Wall Street executives were criminally prosecuted or sentenced to prison for their roles in the crisis. Only one high-level banker in the U.S., Credit Suisse trader Kareem Serageldin, was sentenced to jail time (30 months) for inflating the value of mortgage bonds.  

Major banks (e.g., Goldman Sachs, Citigroup) admitted wrongdoing and paid billions in fines rather than facing criminal trials. For example, Goldman Sachs paid $550 million in 2010 for misleading investors, without admitting guilt.


6. Why Few Were Convicted ? 

Many of the actions leading to the crash, while unethical or reckless, were technically legal at the time. The Financial Crisis Inquiry Commission concluded that the crisis was caused by systemic failures, including reckless behavior, poor regulation, and breaches in ethics.

The “Too Big to Fail” Effect
Many top executives walked away with large bonuses, while taxpayers funded bailouts (TARP) to stabilise the financial system.


Causes Of The Lack Of Accountability

Regulatory Failures: Financial regulators “cheered on” the industry instead of stopping risky practices, believing complex mortgage products would increase homeownership.

Difficulty Proving Fraud:
Criminal fraud is difficult to prove in complex financial cases, making convictions tough to secure.

Focus on Fines: The Department of Justice shifted away from criminal prosecution towards civil settlements, and fines, which did not deter future risk-taking by individuals.

4 Sept 2025 — More people in the United States were experiencing homelessness compared with any year since 2007 (when data collection began). Reflecting significant increases driven by high housing costs and other economic factors, though this number is likely an undercount. This represents about 23 out of every 10,000 Americans, with the largest populations in California and New York, and substantial rises seen across most demographics.


As of December 2025 :  There were approximately 7.5 million unemployed people in the United States, with the national unemployment rate at 4.4%. The number of jobless individuals saw a decrease of 278,000 from the previous month, while the total labour force participation rate stood at 62.4%.

As many as 40%-60% of Americans experiencing homelessness have a job, but housing is unaffordable because wages have not kept up with rising rents. Despite how many houses are in the US, over 580,000 Americans are experiencing homelessness. There are currently 28 vacant homes for every one person experiencing homelessness in the U.S.


As Of early 2026 :   The United States population is approximately 342 to 349 million people. There are 50 states in the United States of America. These 50 states, along with the federal district of Washington, D.C., constitute the country, with Alaska being the largest by area and Hawaii being the most recent state added in 1959.


United States of America Map


The information provided on this site is for general informational purposes only and does not constitute professional advice. Use of any information is solely at your own risk. We also accept no responsibility or liability for the personal opinions published in views, blog posts, opinion pieces or articles that comprise opinion pieces.


University Or Apprenticeship ?

UK Universities


University Or Apprenticeship?

Apprenticeships combine on-the-job training with study to gain industry-recognised qualifications while earning a wage and avoiding student debt. University degrees are academic-focused, involving full-time study for three to four years, often leading to higher tuition debt but offering more flexibility in career paths. 

Almost half of Britons think too many young people go to university. Similarly, almost half of Britons say an apprenticeship prepares young people better for the future than a degree does.  46% of Britons believe apprenticeships offer better preparation for the future, with only 6% favoring university degrees, while 43% see equal value in both paths. This indicates a strong preference for vocational training and on-the-job experience over traditional higher education for career readiness.

As of early 2025, the total outstanding student loan debt in the UK reached over £292 billion. The vast majority of this debt is held in England, where outstanding loans reached £267 billion by March 2025. Projections suggest this figure could reach approximately £500 billion by the late 2040s.


Ref: YouGov


Key Findings on Apprenticeships vs. University:

  • Perceived Superiority: Almost half of the public feels apprenticeships better prepare young people, highlighting a significant shift in perception regarding career preparation.
  • Value of Experience: Apprenticeships are increasingly seen as better for entering the workforce, gaining on-the-job training, and avoiding student debt.
  • Limited Support for Degrees: A very small percentage (6%) view university degrees as superior in preparing for the future, and only 12% think a degree is more likely to lead to success.
  • Shifting Perspectives: The findings reflect a broader sentiment that too many young people go to university.

Over 160 Universities To Choose From

There are over 160 universities in the UK, with figures often cited around 160 -166, though the exact number varies slightly depending on definitions, with some sources listing around 296 total Higher Education Institutions (HEIs) operating in recent years. Major representative bodies like Universities UK represent 142 universities, but other private and specialist providers exist, making the total count higher when all HEIs are included. 

UK universities are under unprecedented financial strain. Without significant policy changes—either raising domestic fees, restoring international recruitment, or increasing government funding—the sector could see widespread restructuring, course cuts, and even institutional failures.

Several countries, primarily in Europe, offer free or very low-cost public university education for domestic and, in some cases, international students. Key nations include Germany, Norway, Finland, Sweden, Denmark, Iceland, Austria, and the Czech Republic. While tuition is free, students often must pay small semester fees and cover high living costs.


Ref: University League Tables 2026 


Graduates Unemployment Rates

As of late 2025 early 2026, there are over 96,000 unemployed recent graduates in the UK each academic year, with some, or potentially more, analysis suggesting up to 400,000 to 700,000 total graduates (aged 16-64) are out of work and on benefits. Graduates are finding it harder to land roles that match their qualifications. Many are forced into jobs that don’t reflect their skills or ambitions.


Over 700,000 University Graduates Are Out Of Work

The  BBC reported that more than 700,000 university graduates are out of work, and claiming welfare benefits.  The introduction of tuition fees and the shift to a loan-based funding system for university students, is frequently cited by critics as one of the most detrimental, long-lasting policies of Tony Blair’s Labour government. Beginning in 1998, this policy marked the end of nearly four decades of free higher education in the UK, and initiated a cycle of rising student debt.


Ref: | BBC |  | Guardian |


Approximately £50,000 Average Student Loan Debts 

Today graduates in England from the 2024/25 academic year face average student loan debts of approximately £53,000. This figure is significantly higher than other UK nations, driven by tuition fees and maintenance loans. While some students have debts exceeding £250,000, most owe over £50,000, with debts often treated as a long-term “graduate tax”.


High Student Loan Rates

UK student loan interest rates are high due to being linked to the Retail Prices Index (RPI) inflation, with Plan 2 (post-2012) and Postgraduate rates reaching up to 7.3%-8% recently before temporary caps. As of September 2025, Plan 2 rates are 3.2% to 6.2%, causing significant debt growth. 


Average Debt by UK Nation (2025 Data)

England: ~£53,000
Wales: ~£39,000
Northern Ireland: ~£28,000
Scotland: ~£17,000


Key Debt Factors
  • Rapid Growth: The average debt in England increased by 10% from roughly £48,270 in the previous year, with total outstanding loans reaching £267 billion by March 2025.
  • Repayment Structure: Only about 56% of full-time undergraduates starting in 2024/25 are forecast to repay their loans in full due to higher interest and longer repayment terms.
  • Loan Characteristics: For many, the debt is not a traditional loan but a “graduate tax,” with 9% of earnings above a threshold paid back for up to 30 or 40 years.
  • Highest Cases: Extreme cases exist, with some student debts in England exceeding £250,000, often resulting from multiple courses and accrued interest. 

£267 Billion As of March 2025 Student Loan Debt In England

The House of Commons Library and Statista  show that he total outstanding student loan debt in England reached £267 billion, with the overall UK balance exceeding £292 billion, driven by rising maintenance costs and interest,  Borrowers in England, particularly those starting in 2024/25, face an average debt of £53,000 upon graduation, with forecasts suggesting this figure will rise further.


Key Student Loan Debt Statistics (UK & England)
  • Total Outstanding Debt:  £266.6 billion in England as of March 2025 (total UK is over £292 billion).
  • Average Debt on Repayment (England):  £53,010 for those finishing in 2024/25, a 9.8% increase.
  • High-Balance Debt:  Over 150,000 UK graduates have debts exceeding £50,000.
  • Interest Rates:  Higher education interest stabilised at £15.2 billion in 2024–25.
  • Forecasted Growth: Outstanding loans are predicted to reach around £500 billion (in 2023-24 prices) by the late 2040s.
  • Repayment Forecasts: Approximately 56% of full-time undergraduates starting in 2024/25 are expected to repay their loans in full due to policy reforms.

Key Student Loan Debt Statistics (Other Regions)

Scotland: £9.4 billion.

Wales: £10.6 billion.
Northern Ireland: £5.6 billion.

The rapid growth in total debt is due to a combination of rising tuition fees, higher living costs, and increased interest rates.


Disclaimer Read More
The information provided on this site is for general informational purposes only and does not constitute professional advice. Use of any information is solely at your own risk. We also accept no responsibility or liability for the personal opinions published in views, blog posts, opinion pieces or articles that comprise opinion pieces.